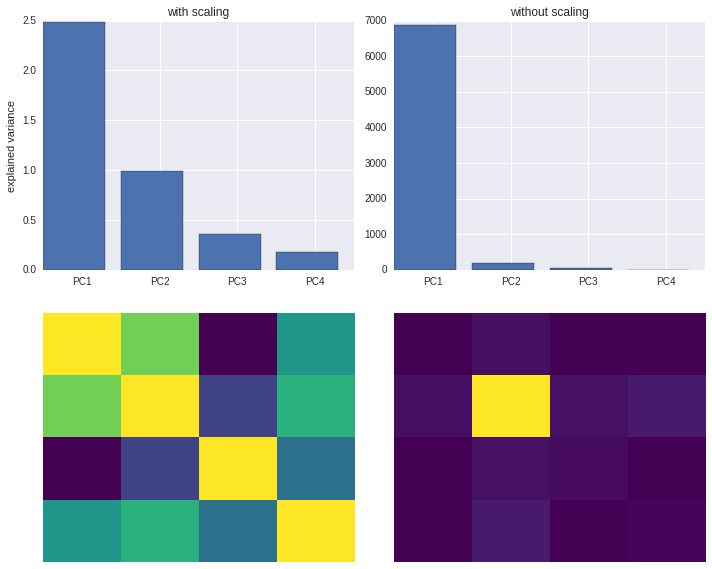
Beware of standardizing data before running PCA!
Standardization is important in PCA since the latter is a variance maximizing exercise. It projects your original data onto directions which maximize the variance. If your features have different scales, then this projection may get screwed!
- References: stackexchange discussion
Experiments
# Main imports
import numpy as np
import pandas as pd

import matplotlib.pyplot as plt
import matplotlib
import seaborn as sns

%matplotlib inline
# Load data
import os
url = "https://vincentarelbundock.github.io/Rdatasets/csv/datasets/USArrests.csv"
in_file = os.path.basename(url)
df = pd.read_csv(in_file if os.path.exists(in_file) else url)
del df["Unnamed: 0"]# Sklearn imports
from sklearn.decomposition import PCA
from sklearn.pipeline import Pipeline
from sklearn.preprocessing import StandardScaler# Fit PCA pipeline with and without scaling / standardization
n_components = 4
pipelines = {}
for with_scaling in [True, False]:
name = "with%s scaling" % ("" if with_scaling else "out")
steps = []
if with_scaling:
name = "with scaling"
steps.append(("scaler", StandardScaler()))
else:
name = "without scaling"
steps.append(("pca", PCA(n_components=n_components)))
pipeline = Pipeline(steps).fit(df)
pipelines[name] = pipeline# Plot the results
def plot_pipelines(pipelines):
_, axes = plt.subplots(len(pipelines), 2)
for i, (row, (name, pipeline)) in enumerate(zip(axes.T, pipelines.items())):
pca = pipeline.steps[-1][1]
ax2, ax1 = row
ax2.set_title(name)
ax1.matshow(pca.get_covariance(), cmap="viridis")
ax1.axis("off")
ax1.set_aspect('auto')
ax2.bar(range(n_components), pca.explained_variance_)
ax2.set_xticks(.5 + np.arange(n_components))
ax2.set_xticklabels(["PC%i" % (c + 1)
for c in range(n_components)])
if i == 0:
ax2.set_ylabel("explained variance")
plt.tight_layout()plot_pipelines(pipelines)Results